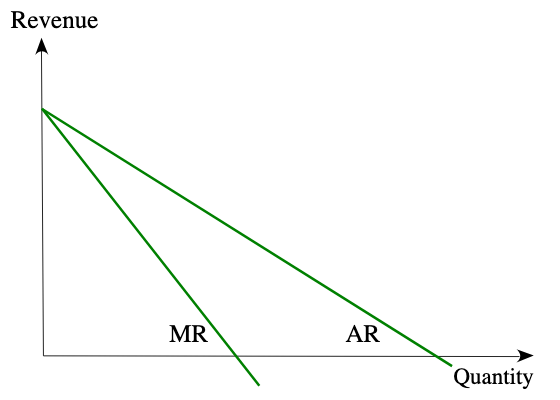
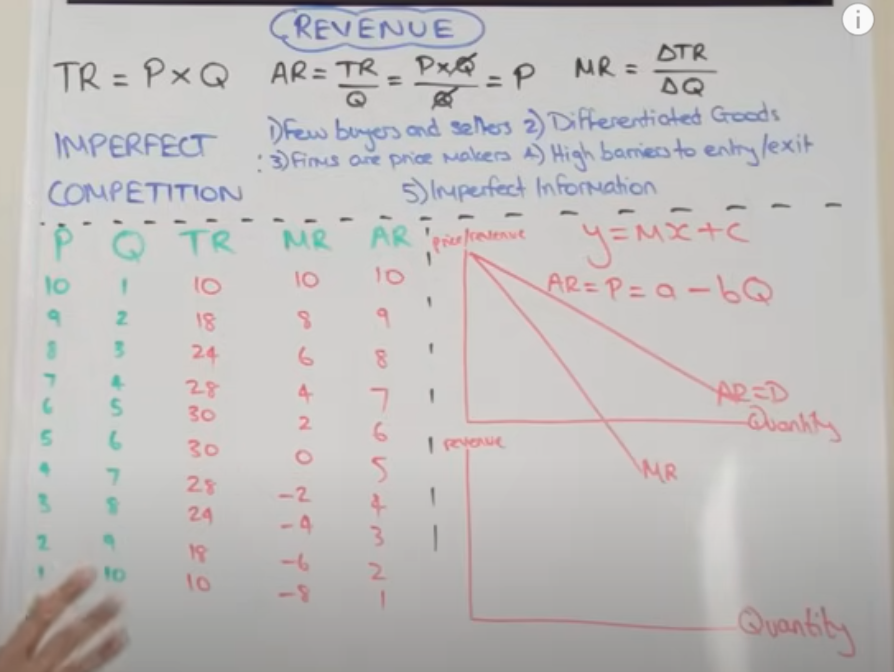
Average revenue: total revenue/ quantity = price x quantity/ quantity = price
Marginal revenue: how much revenue one extra unit adds to a firm's total revenue
Marginal revenue is twice as steep as average revenue
If a good/ service is inelastic in demand, firms can increase their prices and their total revenue will also increase. This is because if price goes up by 10%, demand will fall by less than 10%.
3.3.2 Costs
Total cost = total fixed cost + total variable cost
Total fixed cost: do not change even if output increases e.g rent
Total variable cost: do increase if output increases e.g. wages/ raw materials
Average cost: total cost/ output
Average fixed cost: total fixed cost/ output
Average variable cost: total variable cost/ output
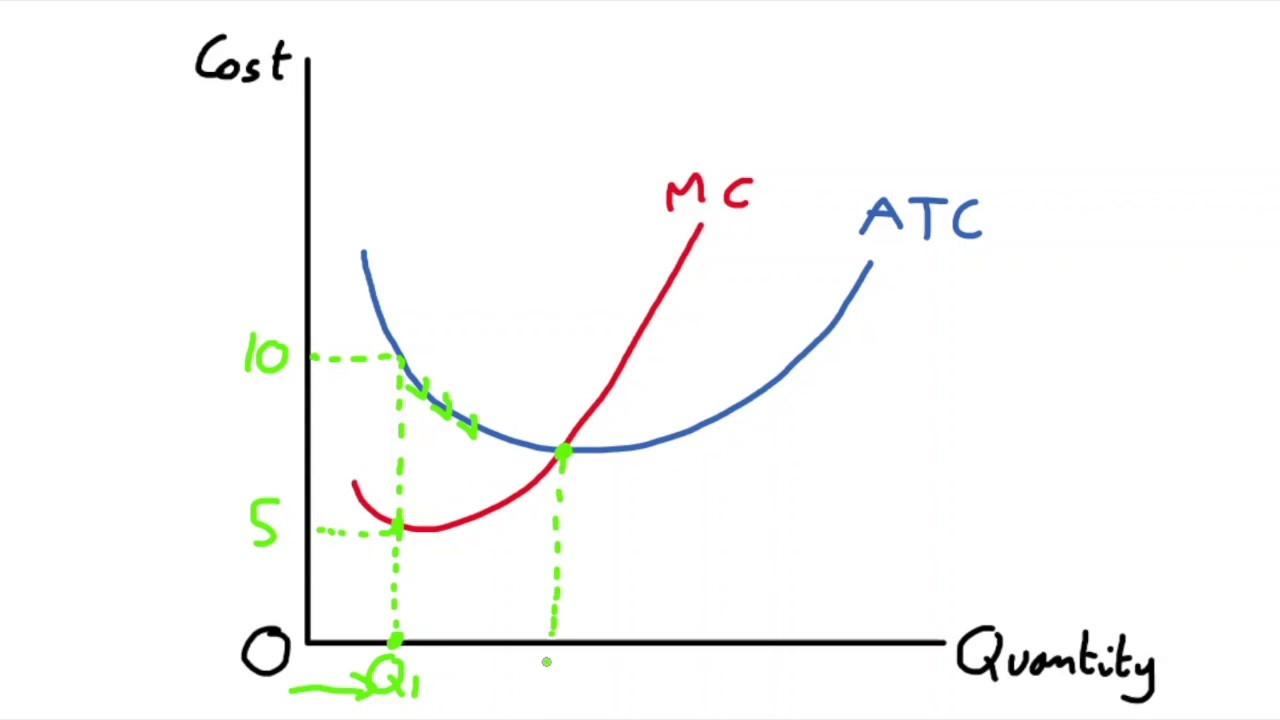
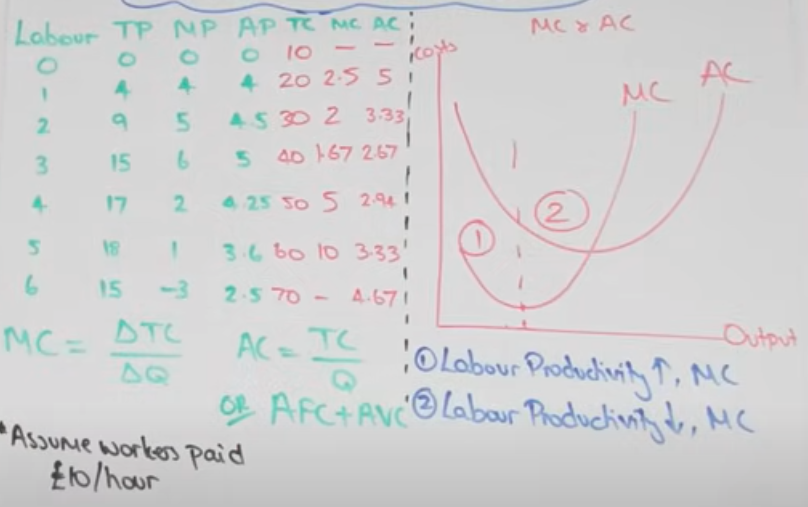
Marginal cost: the extra cost from producing one extra unit of output
Short-run curves
Average cost curve: U-shaped
Marginal cost curve: tick shaped, upward sloping, passes through the lowest point of the average cost curve.
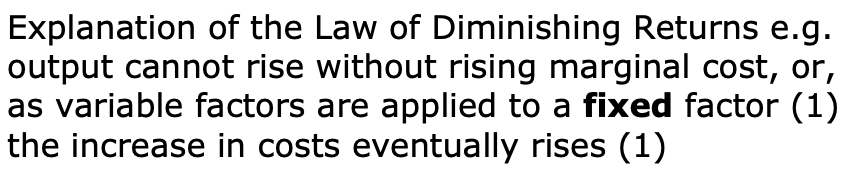
Marginal cost increases as quantity increases due to the law of diminishing marginal productivity
Productivity: output per worker per hour
Law of diminishing marginal productivity: each extra worker is able to add less to a firm's total output than the previous worker.
This happens whenever we add more and more variable factors of production to the same fixed factor of production e.g. adding too many farmers to a small farm.
Short-run: at least one factor of production is fixed e.g. the size of my farm
Long-run: no fixed factors of production.
Example from Edexcel mark scheme
3.3.3 Economies of Scale
Economies of scale are when long-run average costs fall as output rises.
Internal economies of scale occur inside a firm (RFMTMP): risk-bearing, financial, managerial, technological, marketing, and purchasing.
External economies of scale benefit the entire industry: firms can benefit from better transport links and roads, research and development or better education and training available to workers.
Diseconomies of scale occur when output long-run average costs rise as output. They outweigh economies of scale after a certain output (CCC).
communication (workers feel alienated)
co-ordination (difficult for managers to monitor productivity of individual workers).
The minimum efficient scale of production is the lowest output from which the firm is able to produce at the lowest possible LRAC.
3.3.4 Normal profits, supernormal profits and losses
Profit is maximised when MC = MR.
Before q1, marginal revenue is greater than marginal cost. This means that each additional unit of output would add more to total revenue than it does to total costs. Therefore, it makes sense to increase output.
After q1, marginal costs exceed marginal revenue. This means it costs more to produce one extra unit than it would add to total revenue, Therefore, that one extra unit would make a loss. This means profit would decrease from its maximum, so firms would choose to remain at the quantity where MC = MR.
Remember: total costs in economics includes explicit costs (raw materials/ rent) and implicit costs (opportunity cost). For example, total costs could include £20,000 of wages and £30,000 of opportunity cost
Normal profit is made when there are zero supernormal profits. Total revenue = total costs or average revenue = average costs.
For example,
total revenue = £50,000
total variable costs = £20,000
opportunity cost = £30,000
Supernormal profit: any profit above normal profit e.g. TR > TC or AR > AC.
Supernormal loss: any profit below normal profit e.g. TR < TC or AR < AC.
Long-run shutdown point: if TC > TR (AC > AR), a firm would choose to shut down in the long-run.
Short-run shutdown point: if AR < AVC, a firm would choose to shut down in the short-run.